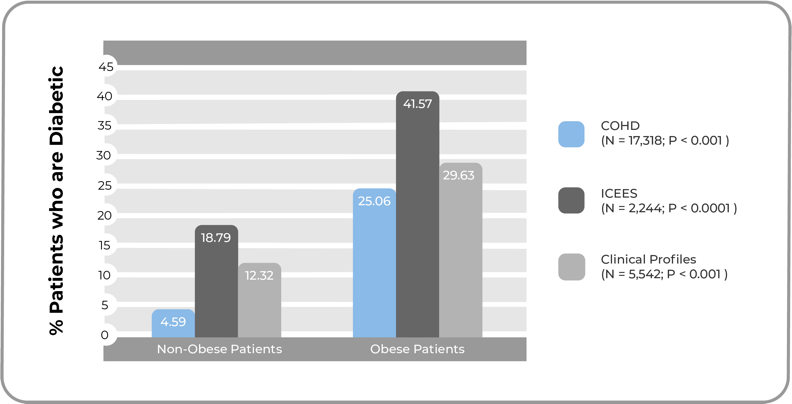
HHS/NCATS Logo

TRANSLATOR TIDBIT 03

Utilizing Open Clinical Data to Predict Patient Outcomes

Finding correlations between environmental phenomena within severe asthma patient cohorts.

If you have questions about Tidbits, click here to contact us!

TRANSLATOR TIDBIT 01

I want to know if...

Asthma is a clinical syndrome characterized by episodic airflow obstruction secondary to bronchoconstriction and mucus secretion and is associated with airway hyperresponsiveness and airway inflammation. Obesity (or Body Mass Index, BMI) and diabetes appear to be important comorbidities for asthma. Imagine a scenario in which a translational scientist is seeking more information on treating asthma patients. These patients have severe asthma that does not get better with standard treatment. Many of them are female and additionally suffer from obesity or diabetes. The researcher decides to use Translator to look at clinical data that is openly accessible, including a broad range of patient characteristics, and utilizes the large sample size represented in the data to see if these patients represent a defined subtype of asthma patients who should follow a particular course of treatment.

How Might Translator Help?

Research on clinical data is, justifiably, subject to a variety of regulations and restrictions (including HIPAA). Due to restrictions on clinical data access, this type of data can be difficult for researchers to access. This lack of access creates unnecessary barriers to translating research findings to clinical and public health situations.

Could Translator use open clinical data sources to allow more precise classification of patients so they can be treated in a more individual way?

Translator Insight

Utilizing Translator, there are several approaches to accessing open clinical data; these include Johns Hopkins Medicine’s Clinical Profiles database, the Columbia Open Health Data (COHD) database, and the UNC Health Care System’s Integrated Clinical and Environmental Exposures Service (ICEES). These data provide an opportunity to compare findings and quickly conduct exploratory analysis. In this case, the clinical data suggested an environmental difference among the patient cohorts confirming established interactions between sex, obesity and diabetes. Researchers identified commonalities and differences in these interactions among the three Translator Clinical Knowledge Sources. Additionally, researchers used ICEES to identify suspected interactions between high exposure to particulate matter and diabetes. Particulate matter exposure is defined using the PM2.5 score, which is a measure of the particulate matter of at least 2.5 microns in size in the air.

The Power of Translator

Conducting analyses on open clinical knowledge sources
Translator utilized three open clinical knowledge sources drawn from different health care systems to successfully assess interactions between sex, obesity, diabetes and exposure to airborne pollutants among patients with severe asthma. This kind of information provided by Translator could help better define inclusion and exclusion criteria for a clinical trial.

Data Sources

Clinical Profiles

Represents statistical profiles of disease, including data on demographics, diagnoses and disease comorbidities, laboratory tests, procedures, and medications; derived from observational patient data collected by Johns Hopkins Medicine.

COHD

An open clinical database including counts and frequencies of conditions, procedures, drug exposures and patient demographics derived from the Columbia University Medical Center’s Observational Health Data Sciences and Informatics (OHDSI) database.

ICEES

A complex extraction, conversion and integration pipeline, derived from the UNC Health Care System, that integrates clinical and exposures data while keeping the data openly accessible.

ROBOKOP

A reasoning tool created for Translator that uses data from myriad open databases to make connections between seemingly unrelated data points.

Process Details:

Three open clinical databases (COHD, Clinical Profiles and ICEES) were utilized to collect cohorts of patients with a diagnosis of severe asthma and prescription of prednisone. COHD patient cohorts were then stratified by several clinical features, including sex, obesity status and diabetes diagnosis. Patients from the ICEES cohort also were stratified by their average and maximum daily exposure to particulate matter (PM2.5 score). These features were used to determine correlation scores with asthma diagnosis and features that showed a statistically significant correlation (with a P value of less than 0.1) using the ROBOKOP reasoning tool.

Supporting Data:

This graph shows the percentage of patients who had two or more annual clinic visits for respiratory issues, compared with their exposure to particulate matter, as reported in the ICEES database. The left panel, which uses the patients’ average daily PM2.5 score in micrograms per cubic meter, shows that 7.93 percent of patients with lower exposures (average PM2.5 from 1.58 to 9.62) had two or more clinic visits, while 15.84 percent of patients with mid-range exposures (average greater than 9.62 and up to 9.63) and 21.3 percent of patients with higher levels of exposure (average greater than 9.63 and up to 17.33) had at least two visits. The right panel, which uses the patients’ maximum daily PM2.5 score in micrograms per cubic meter, shows that 8.89 percent of patients in the lowest exposure category (maximum daily exposure from 6.77 to 42.02) had at least two clinic visits, while 15.29 percent of patients with a maximum exposure greater than 42.02 and up to 46.21, 19.9 percent of those with a maximum exposure greater than 46.21 and up to 47.06, and 29.33 percent of those with a maximum exposure greater than 47.06 and up to 114.94 had at least two clinic visits for respiratory issues in a year.
Figure 1: PM2.5 exposure and health outcomes among patients with asthma-like conditions. The percentage of patients with two or more annual emergency room or inpatient visits for respiratory issues increases with exposure to increasing levels of PM2.5, for both average daily PM2.5 exposure (left panel) and maximum daily PM2.5 exposure (right panel). These findings replicate published literature on the association between airborne exposures and asthma exacerbations (e.g., Mirabelli et al. 2016). Results were derived using ICEES.


This graph shows the percentage of patients diagnosed with diabetes compared to their obesity status (obesity is defined as a BMI score of 30 or higher) in each of the three open clinical databases described here. In COHD, 4.59 percent of non-obese patients are diabetic, compared to 25.06 percent of obese patients (of 17,318 total patients in the database), a significant difference with a P value of less than 0.001. In ICEES, 18.79 percent of non-obese patients are diabetic, compared to 41.57 percent of obese patients (of 2,244 total patients), a significant difference with a P value of less than 0.0001. Finally, in Clinical Profiles, 12.32 percent of non-obese patients are diabetic, compared to 29.63 percent of obese patients (of 5,542 total patients), a significant difference with a P value of less than 0.001.
Figure 2: Rates of diabetes among obese and non-obese patients in the general population (COHD) and in cohorts with asthma-like conditions (ICEES, Clinical Profiles). Diabetes is more common among obese patients than among non-obese patients. Moreover, rates of diabetes are higher overall among patients with asthma-like conditions (COHD, Clinical Profiles) than among the general patient population (COHD). Obesity is defined as a BMI score of 30 or higher for this purpose.


This figure shows the percentage of patients who are obese or diabetic compared to their maximum daily exposure to particulate matter as derived from ICEES data. Patients with lower maximum daily PM2.5 (up to 47.06 micrograms per cubic meter) have lower incidence of obesity and diabetes, with 13.62 percent of patients being obese and 19.59 percent being diabetic. Those with higher maximum daily exposure (greater than 47.06 micrograms per cubic meter) showed a higher rate of both obesity and diabetes, with 17.83 percent of patients in this group being obese (a marginally significant increase with P value of 0.0593) and 26.21 percent being diabetic (a significant increase with P value less than 0.01).
Figure 3: Rates of obesity and diabetes in relation to PM2.5 exposure among patients with asthma-like conditions. Obesity and diabetes are more common among patients exposed to relatively high maximum daily levels of PM2.5 than among patients exposed to relatively low maximum daily levels of PM2.5. Results were derived using ICEES and are significant for diabetes and marginally significant for obesity.

References
https://smart-api.info/registry?q=COHD
https://icees.renci.org/apidocs
https://ascpt.onlinelibrary.wiley.com/doi/full/10.1111/cts.12638
https://academic.oup.com/jamia/advance-article/doi/10.1093/jamia/ocz042/5480568
https://www.nature.com/articles/sdata2018273
https://asthmarp.biomedcentral.com/articles/10.1186/s40733-019-0048-y

Zero to 60 Drugs in Three Seconds - Finding New Uses for Existing Drugs to Treat Parkinson’s Disease
02

Zero to 60 Drugs in Three Seconds - Finding New Uses for Existing Drugs to Treat Parkinson’s Disease

Finding Marketed Drugs that might Treat an Unknown Syndrome by Perturbing the Disease Mechanism Pathway
04

Finding Marketed Drugs that might Treat an Unknown Syndrome by Perturbing the Disease Mechanism Pathway

Finding Unanticipated Patterns in Clinical Cohorts Using Open Clnical Data
05

Finding Unanticipated Patterns in Clinical Cohorts Using Open Clnical Data